Skip to primary content
UCF D4 Ecology Lab
[demography X diversity X distribution X dispersal]
Search
Main menu
Home
News
People
Lab Members
Photo Gallery
Research
Publications
Pedro Quintana-Ascencio and colleagues
Dave Jenkins and colleagues
Jack Stout and colleagues
Former Classes
Advanced Ecology, F ’24
Biogeography, F ’24
Conservation Biology
Methods 2
Methods 1
Resources for Methods 1
Links
Useful Resources
Collections and Societies
News Sources
Humor & Gravitas
UCF Links
Image navigation
← Previous
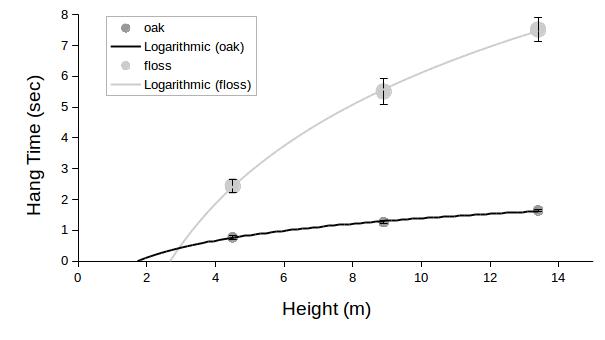
seed drop outcome
Published
September 23, 2018
at
605 × 340
in
Biogeography (undergraduate)
We use cookies to enhance your browsing experience and analyze our traffic. By clicking "Accept", you consent to our use of cookies.
UCF Privacy Policy
.
Accept